two dimensional gis browser
(Note: the viewer is no longer functional due to increased security requirements for java plugins - we present the page here for historical purposes only. All of these functions can now be realized with our Georefenecer tools).
This is a special GIS (Geographic Information System) Browser that allows integration and interaction of historical maps with current geospatial data and other historical maps. Examination of the maps in GIS reveals changes in the history of the areas shown on the maps.
Eleven historical maps of the San Francisco Bay area from 1851 to 1926, eighteen historical maps of the Boston area from 1776 thru 1897, over thirty historical maps covering the area of the 1804 - 1806 Lewis and Clark Expedition, 35 maps of Washington D.C., and 32 maps of New York City are now available for viewing in the GIS Browser. Additional historic maps of U.S. cities and regions will be added in the near future including Los Angeles, Chicago, Denver, Seattle, Yosemite Valley, and Lake Tahoe. The current geospatial data that can be overlaid and compared to the historical maps includes roads, lakes, vparks, state boundaries, digital orthophotos (aerial photography), topographic mapsheets, digital elevation models and satellite imagery. Many of these maps may also be viewed in our Google Earth viewer.
For a detailed explanation of the process of georeferencing historical maps, read Historical Maps and GIS by David Rumsey and Meredith Williams that appears in Past Time Past Place published by ESRI Press.
The following were available for viewing with the 2D GIS Browser:
( Clicking the links below will both expand and minimize the enclosed information )
- Boston (click link to minimize)
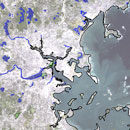
Eighteen historical maps of the Boston area from 1776 thru 1897 from the David Rumsey Collection are now available for viewing in the GIS Browser. Additional historic maps of U.S. cities will be added in the near future including Washington, New York, Los Angeles, Chicago, Denver, and Seattle.
The current geospatial data that can be overlaid and compared to the historical maps includes roads, lakes, parks, state boundaries, digital orthophotos (aerial photography), topographic mapsheets, digital elevation models and satellite imagery. Users can create, save, and print custom maps, as well interactively blend/fade/merge and overlay/swipe multiple map layers for enabling real-time visual change analysis over the Internet. Results of the user customized map layer visualizations can be saved and downloaded as new images, complete with the georeferencing information, thereby allowing easy integration into other desktop GIS applications.
- Lewis and Clark Expedition (click link to minimize)
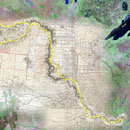
In order to mark the 200th anniversary of the Lewis and Clark Expedition, and to share the cartographic history of the exploration, approximately 30 of the most significant historical maps of the region from the David Rumsey Collection are now available on-line via the GIS Viewer. This visual voyage of discovery through the map history of the Lewis and Clark Expedition starts with pre-expedition maps of the early 1800's, then includes Lewis' original 1814 map of the expedition routes, next carries through to the first complete Government Land Office surveys of the late 1800's, then into the modern age 1970 National Atlas, and finally to the space age of satellite imagery. The David Rumsey GIS Viewer allows on-line visitors a unique opportunity to easily interact with, integrate, and visualize these historic maps along with the modern geospatial data from NASA, USGS, ESRI and GCS Research.
The modern geospatial data that can be overlaid and compared to the historical maps includes urban areas, transportation infrastructure (roads, rail), public land survey, lakes, parks, state boundaries, digital elevation models and satellite imagery. Users can create, save, and print custom maps, as well interactively blend/fade/merge and overlay/swipe multiple map layers for enabling real-time visual change analysis over the Internet. Results of the user customized map layer visualizations can be saved and downloaded as new images, complete with the georeferencing information, thereby allowing easy integration into other desktop GIS applications.
- Mt. Washington, Nevada (click link to minimize)

Twenty maps of the area around Mount Washington, Great Basin National Park, Nevada, are now available for viewing in the GIS Browser. This GIS was created for The Long Now Foundation, to show the location of their 10,000 year Clock on the Foundation's property just south of Mount Washington.
The current geospatial data that can be overlaid and compared to the historical maps includes roads, lakes, parks, state boundaries, digital orthophotos (aerial photography), topographic mapsheets, digital elevation models and satellite imagery. Users can create, save, and print custom maps, as well interactively blend/fade/merge and overlay/swipe multiple map layers for enabling real-time visual change analysis over the Internet. Results of the user customized map layer visualizations can be saved and downloaded as new images, complete with the georeferencing information, thereby allowing easy integration into other desktop GIS applications.
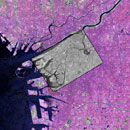
- New York City (click link to minimize)

Thirty-two historical maps of New York City from 1776 to 1918 are now available for viewing in the GIS Browser. Additional historic maps of U.S. cities will be added in the near future including Los Angeles, Chicago, Denver, and Seattle.
The current geospatial data that can be overlaid and compared to the historical maps includes roads, lakes, parks, state boundaries, digital orthophotos (aerial photography), topographic mapsheets, digital elevation models and satellite imagery. Users can create, save, and print custom maps, as well interactively blend/fade/merge and overlay/swipe multiple map layers for enabling real-time visual change analysis over the Internet. Results of the user customized map layer visualizations can be saved and downloaded as new images, complete with the georeferencing information, thereby allowing easy integration into other desktop GIS applications.
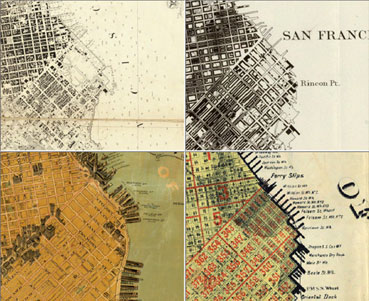
- San Francisco (click link to minimize)
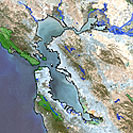
Eleven historical maps of the San Francisco Bay area from 1851 to 1926 from the David Rumsey Collection are now available for viewing in the GIS Browser. Additional historic maps of U.S. cities will be added in the near future including Washington, New York, Los Angeles, Chicago, Denver, and Seattle.
The current geospatial data that can be overlaid and compared to the historical maps includes roads, lakes, parks, state boundaries, digital orthophotos (aerial photography), topographic mapsheets, digital elevation models and satellite imagery. Users can create, save, and print custom maps, as well interactively blend/fade/merge and overlay/swipe multiple map layers for enabling real-time visual change analysis over the Internet. Results of the user customized map layer visualizations can be saved and downloaded as new images, complete with the georeferencing information, thereby allowing easy integration into other desktop GIS applications.
- Washington D. C. (click link to minimize)

Thirty-five historical maps of Washington, D.C., from 1791 to 1917 are now available for viewing in the GIS Browser. Twenty-nine of the maps are from the Library of Congress, Geography and Map Division. The metadata listings for those maps include links to the original map images and bibliographic data on the Library of Congress Web site. The other six maps are from the David Rumsey Collection. Additional historic maps of U.S. cities will be added in the near future including New York, Los Angeles, Chicago, Denver, and Seattle.
The current geospatial data that can be overlaid and compared to the historical maps includes roads, lakes, parks, state boundaries, digital orthophotos (aerial photography), topographic mapsheets, digital elevation models and satellite imagery. Users can create, save, and print custom maps, as well interactively blend/fade/merge and overlay/swipe multiple map layers for enabling real-time visual change analysis over the Internet. Results of the user customized map layer visualizations can be saved and downloaded as new images, complete with the georeferencing information, thereby allowing easy integration into other desktop GIS applications.
- Kyoto, Japan (click link to minimize)

Six historical maps of Kyoto, Japan, from 1709 to 1889 from the East Asian Library, UC-Berkeley, are now available for viewing in the GIS Browser. The maps have been scanned and georectified by David Rumsey and Cartography Associates for the East Asian Library at UC-Berkeley. The map images are Copyright© 2002 by the UC Regents.
The current geospatial data that can be overlaid and compared to the historical maps includes roads, lakes, parks, provincial boundaries, digital orthophotos (aerial photography), topographic mapsheets, and satellite imagery. Users can create, save, and print custom maps, as well interactively blend/fade/merge and overlay/swipe multiple map layers for enabling real-time visual change analysis over the Internet. Results of the user customized map layer visualizations can be saved and downloaded as new images, complete with the georeferencing information, thereby allowing easy integration into other desktop GIS applications.
- Osaka, Japan (click link to minimize)
Ten historical maps of Osaka, Japan, from 1657 to 1913 from the East Asian Library, UC-Berkeley, are now available for viewing in the GIS Browser. The maps have been scanned and georectified by David Rumsey and Cartography Associates for the East Asian Library at UC-Berkeley. The map images are Copyright© 2002 by the UC Regents.
The current geospatial data that can be overlaid and compared to the historical maps includes roads, lakes, parks, provincial boundaries, digital orthophotos (aerial photography), topographic mapsheets, and satellite imagery. Users can create, save, and print custom maps, as well interactively blend/fade/merge and overlay/swipe multiple map layers for enabling real-time visual change analysis over the Internet. Results of the user customized map layer visualizations can be saved and downloaded as new images, complete with the georeferencing information, thereby allowing easy integration into other desktop GIS applications.
- Tokyo, Japan (click link to minimize)
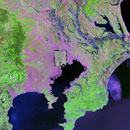
Thirteen historical maps of Tokyo, Japan, from 1680 to 1910 from the East Asian Library, UC-Berkeley, are now available for viewing in the GIS Browser. The maps have been scanned and georectified by David Rumsey and Cartography Associates for the East Asian Library at UC-Berkeley. The map images are Copyright© 2002 by the UC Regents.
The current geospatial data that can be overlaid and compared to the historical maps includes roads, lakes, parks, provincial boundaries, digital orthophotos (aerial photography), topographic mapsheets, and satellite imagery. Users can create, save, and print custom maps, as well interactively blend/fade/merge and overlay/swipe multiple map layers for enabling real-time visual change analysis over the Internet. Results of the user customized map layer visualizations can be saved and downloaded as new images, complete with the georeferencing information, thereby allowing easy integration into other desktop GIS applications.